Merchants Bancorp (MBIN)·Q4 2025 Earnings Summary
Merchants Bancorp Posts $1.28 EPS as Credit Quality Improves, Hits Record Asset Levels
January 28, 2026 · by Fintool AI Agent
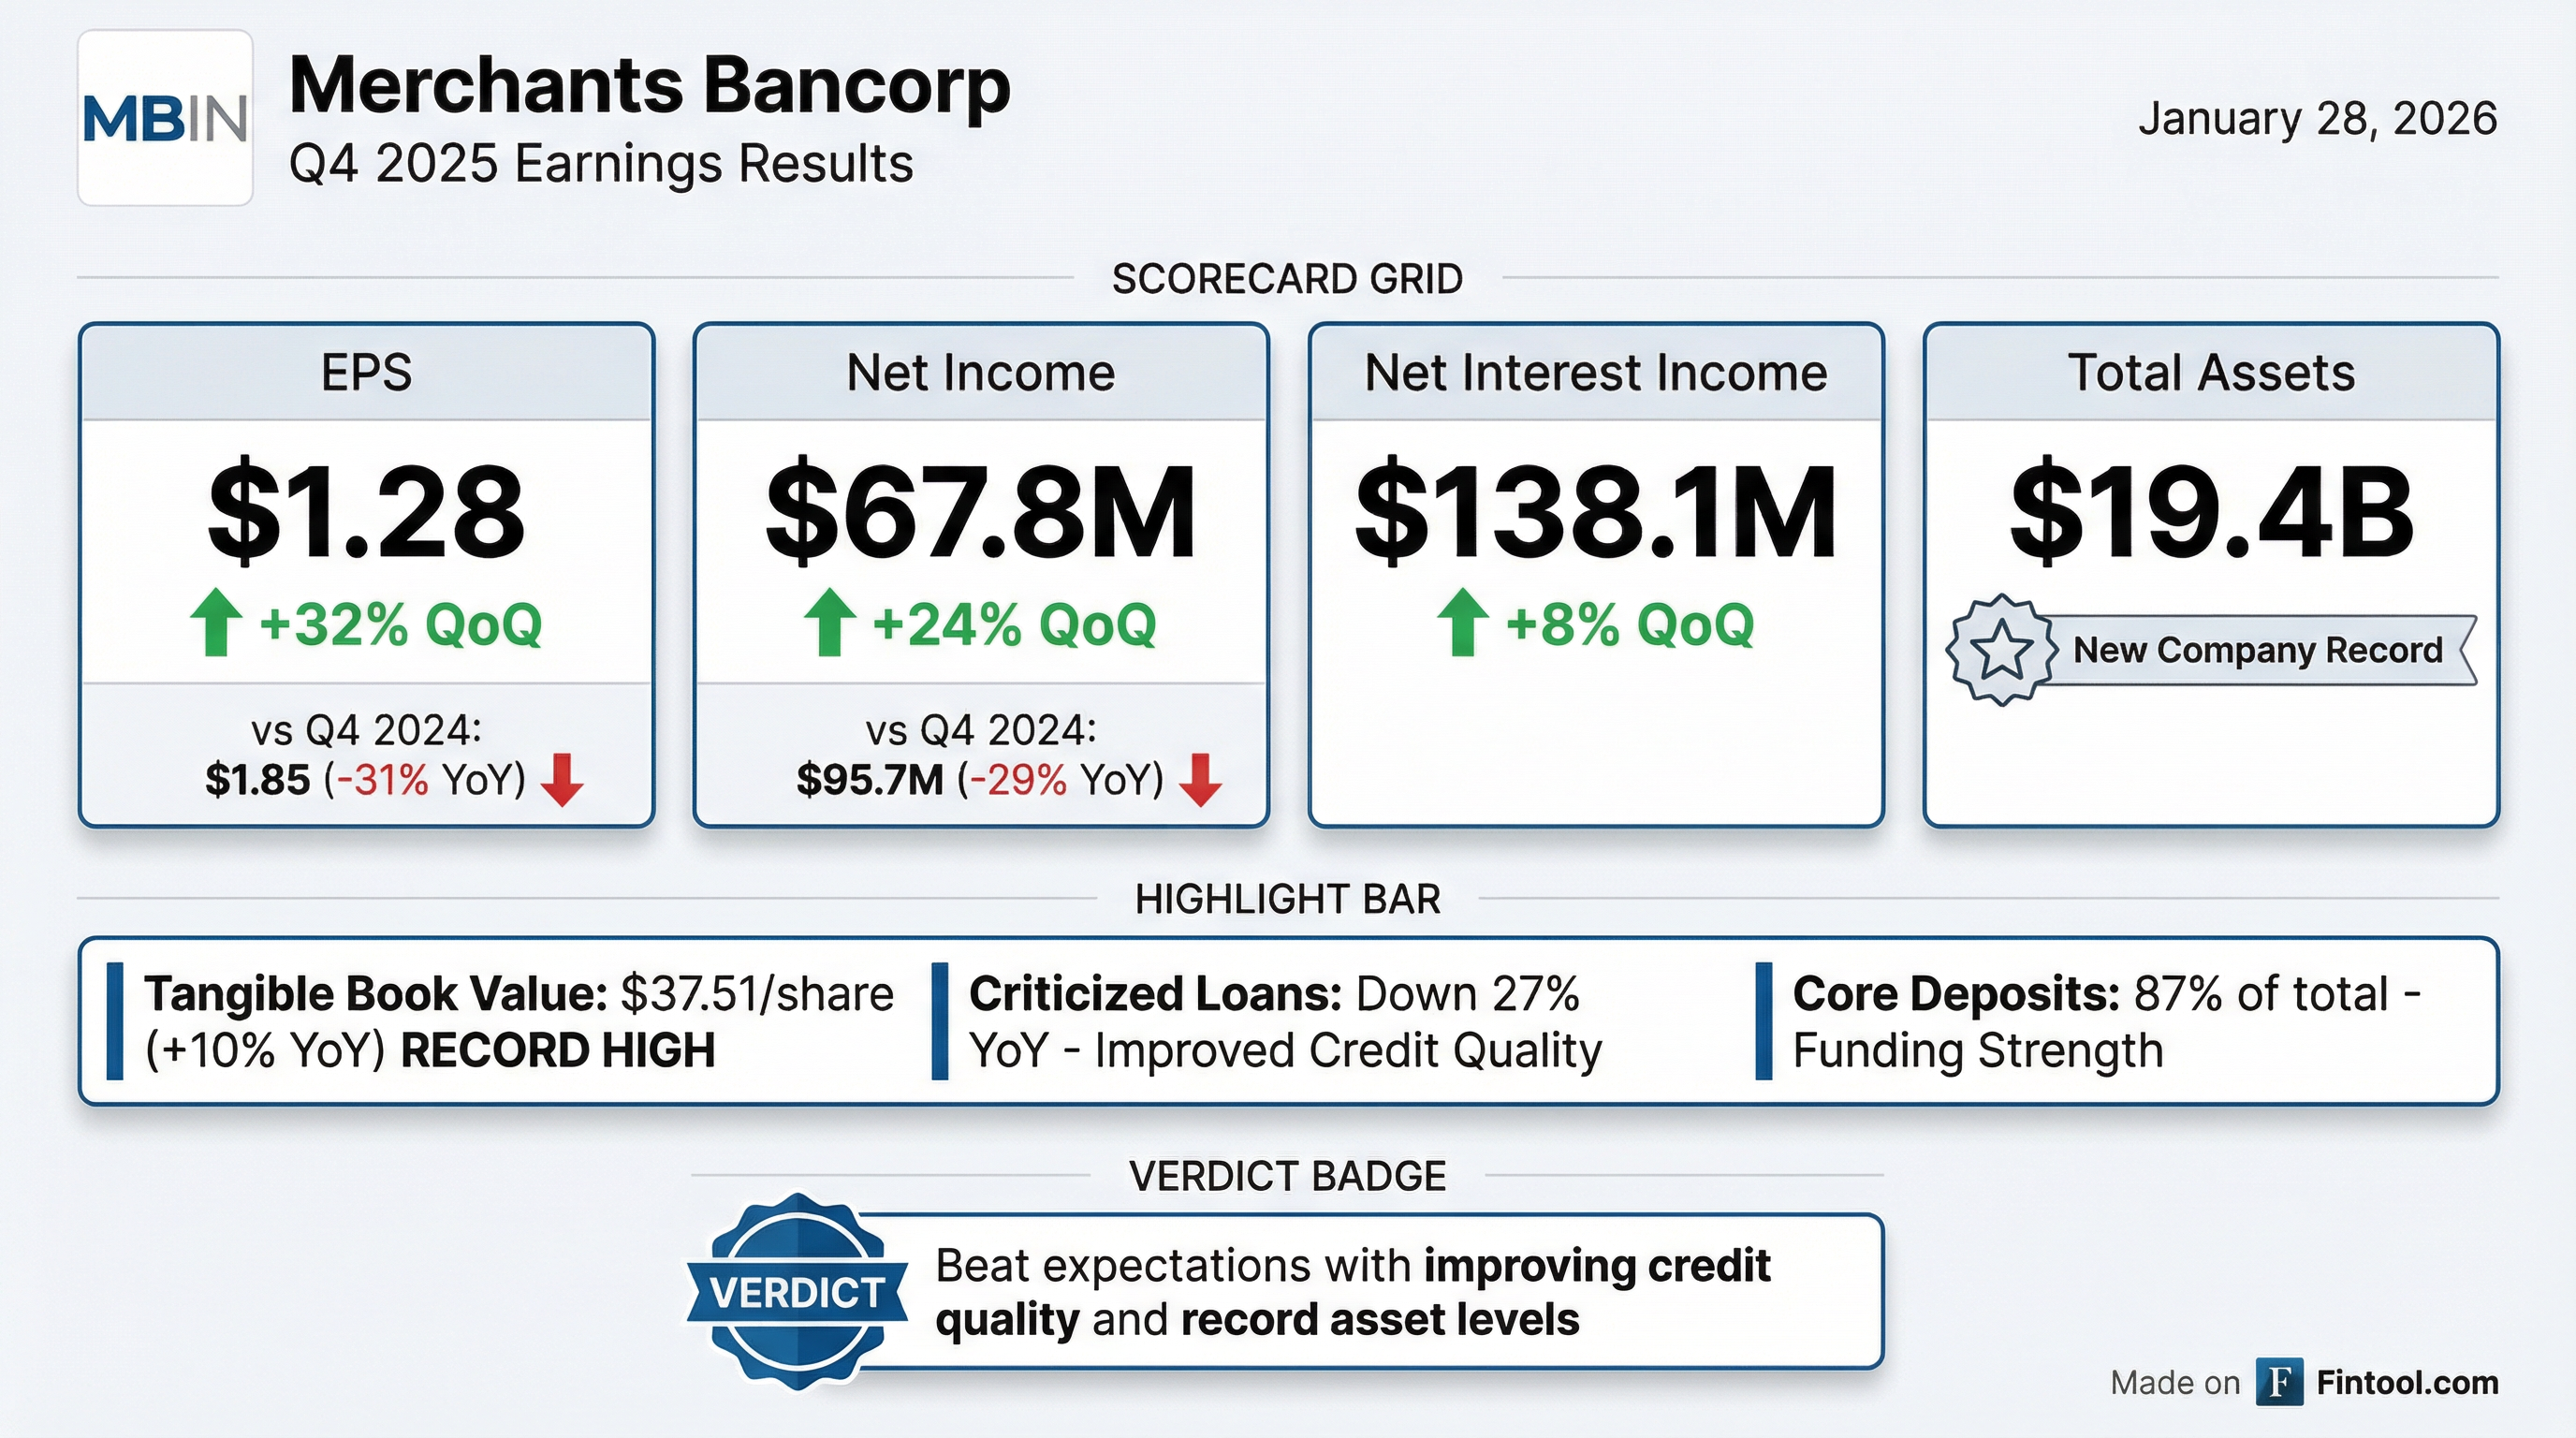
Merchants Bancorp (NASDAQ: MBIN) reported Q4 2025 results that marked what management called a "decisive shift" for the Indiana-based bank holding company. Diluted EPS of $1.28 surged 32% sequentially from $0.97 in Q3 2025, while net income of $67.8 million increased 24% quarter-over-quarter . The company achieved record total assets of $19.4 billion, record tangible book value of $37.51 per share, and its highest-ever quarterly gain on sale of multi-family loans .
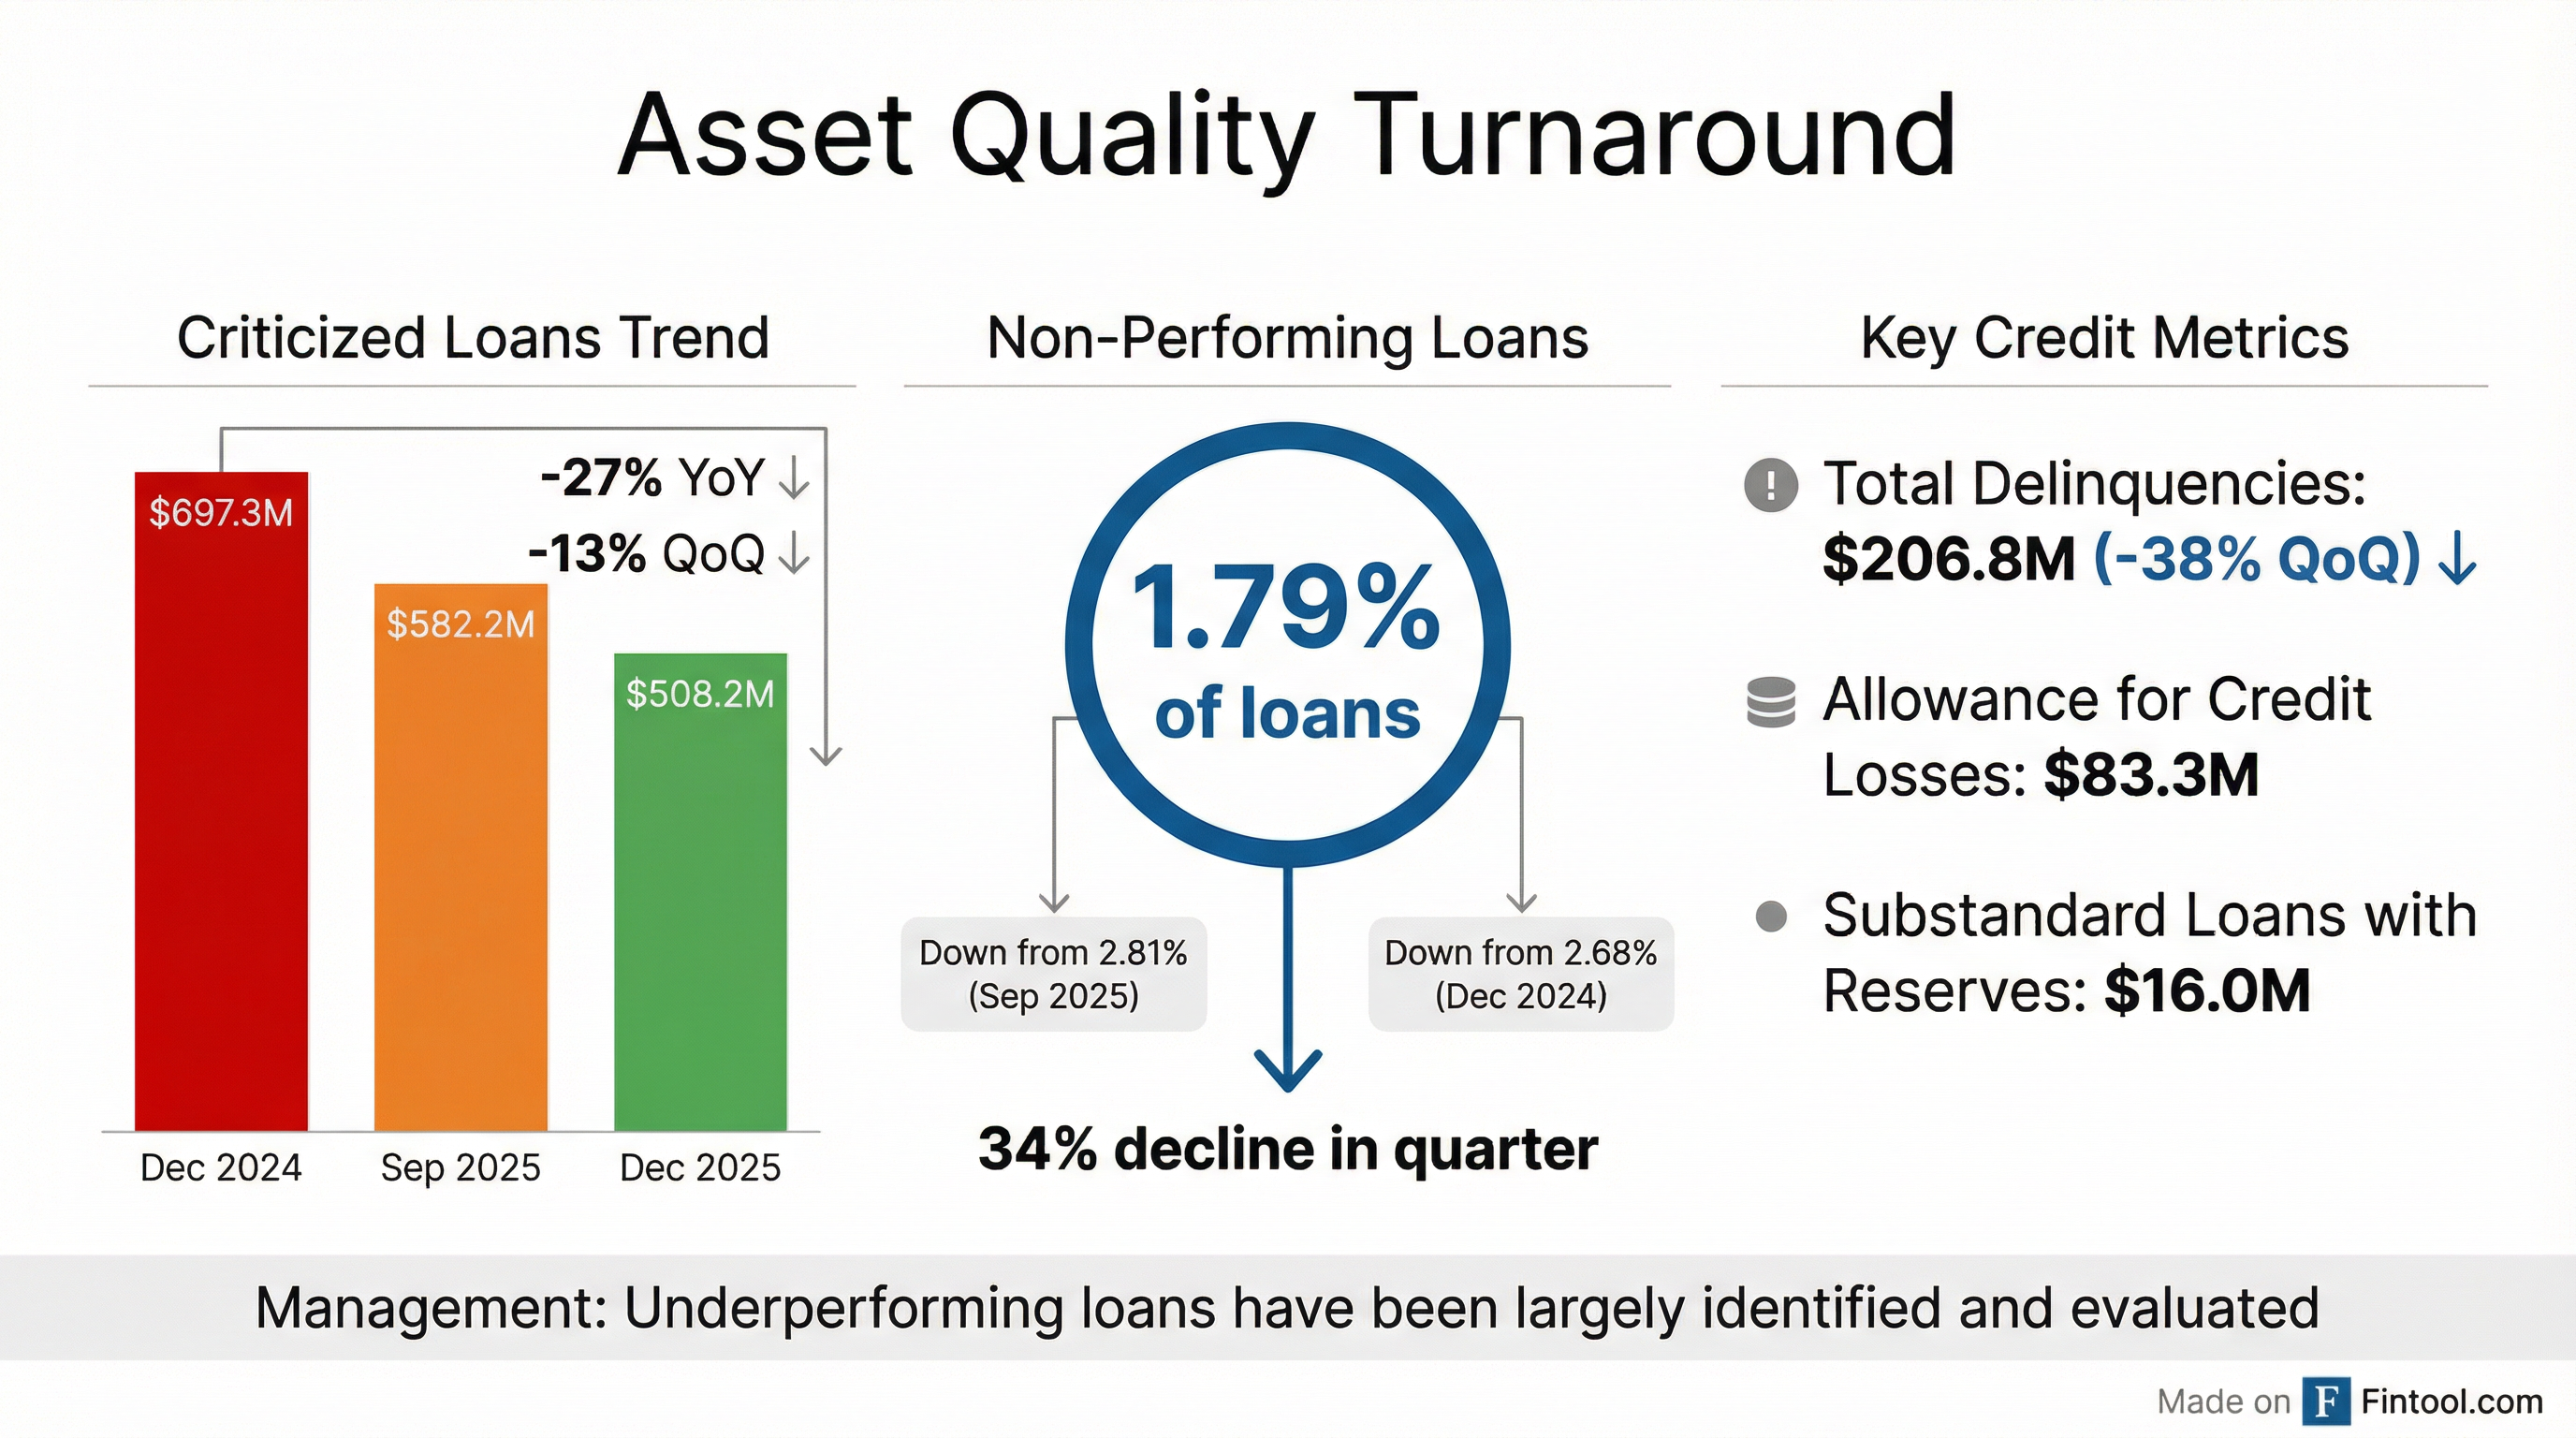
Most notably, asset quality improved materially: criticized loans dropped 27% year-over-year to $508 million, non-performing loans fell 34% sequentially, and total delinquencies declined 38% quarter-over-quarter .
Did Merchants Bancorp Beat Earnings?
Yes — decisively. MBIN's Q4 2025 results exceeded expectations across key metrics:
Values based on consensus estimates from S&P Global
The EPS beat was driven by three factors: (1) net interest income rose 8% sequentially to $138.1 million on lower funding costs ; (2) provision expenses declined as credit quality improved ; and (3) tax credits reduced the effective tax rate .
However, year-over-year comparisons remain challenged. Q4 2025 EPS of $1.28 was down 31% from Q4 2024's $1.85, and full-year 2025 net income of $218.8 million declined 32% from 2024's $320.4 million .
What Changed From Last Quarter?
The Q4 results represent a meaningful inflection from the challenging Q2-Q3 2025 period:
Credit Quality Turnaround:
- Criticized loans: $508M (down from $582M in Q3, $697M in Q4 2024)
- Non-performing loans: 1.79% of loans (down from 2.81% in Q3, 2.68% in Q4 2024)
- Total delinquencies: $207M (down 38% from $336M in Q3)
Net Interest Margin Expansion:
- NIM: 2.89% (up 7 bps from 2.82% in Q3)
- Interest rate spread: 2.44% (up 11 bps from 2.33%)
- Funding costs declining faster than asset yields
Record Multi-Family Gains:
- Gain on sale of multi-family loans: $24.8M (highest in company history)
- Driven by continued strength in Freddie Mac-sponsored Q-Series securitizations
What Did Management Say?
CEO Michael Petrie framed Q4 as a turning point:
"This quarter reflects a decisive shift for Merchants. Asset quality improved meaningfully, with criticized loans down 13% and nonperforming loans reduced by nearly one-third during the quarter. We also achieved a record tangible book value of $37.51 per share and the strongest quarterly gain on sale of multi-family loans in our history."
President Michael Dunlap emphasized operational execution:
"Our team's disciplined execution and commitment to excellence have driven meaningful progress. The improvement in credit quality, combined with strong liquidity and operational performance, reinforces our confidence in the year ahead."
Management explicitly stated that "underperforming loans have been largely identified and evaluated for potential losses that have either been included in the allowance for credit losses on loans as specific reserves or charged-off" — signaling the worst of credit migration may be behind them.
Key Metrics by Segment
Merchants operates three primary segments. Q4 2025 net income by segment :
Mortgage Warehousing was the standout performer, with net income up 48% QoQ driven by higher loan volumes and improved spreads.
Total assets by segment as of December 31, 2025 :
- Banking: $11.3B (58%)
- Mortgage Warehousing: $7.3B (37%)
- Multi-family Mortgage Banking: $526M (3%)
Balance Sheet Highlights
Deposit Mix Improvement: Core deposits now represent 87% of total deposits (up from 79% a year ago), while brokered deposits declined 31% YoY to $1.8B .
Liquidity Strength: Unused borrowing capacity of $5.3B (27% of assets) through FHLB and Fed Discount Window .
Capital Position
Merchants' capital ratios remain well above regulatory minimums :
Return metrics showed sequential improvement:
- Return on Average Assets: 1.37% (vs 1.16% in Q3)
- Return on Average Tangible Common Equity: 13.76% (vs 10.69% in Q3)
How Did the Stock React?
MBIN shares closed at $34.95 on January 28, 2026, down 0.31% on the day the results were released. The muted reaction suggests the improving credit quality narrative was partially priced in following Q3's sequential improvement signals.
Year-to-date context:
- 52-week high: $43.82
- 52-week low: $27.25
- Current price: $34.95 (20% below 52-week high)
The stock remains 2% above its 50-day moving average ($34.22) and 6% above its 200-day moving average ($32.82).
Risks and Concerns
Despite the positive momentum, several risks warrant monitoring:
-
Multi-family concentration: The loan portfolio remains heavily weighted to multi-family financing ($5.3B, 48% of loans receivable) , which has been the source of elevated charge-offs.
-
Charge-off activity: Q4 saw $38.0M in charge-offs across 12 relationships, with ~75% tied to just three borrowers . While specific reserves have been established, concentration risk remains.
-
Interest rate sensitivity: The net interest margin benefited from rapidly declining funding costs; this tailwind may moderate if rate cuts slow.
-
Year-over-year declines: Full-year 2025 EPS of $3.78 was down 40% from 2024's $6.30 , reflecting the lingering impact of credit normalization.
Forward Catalysts
Positive:
- Continued credit quality improvement as criticized loans migrate toward resolution
- Multi-family loan origination pipeline (gain on sale momentum)
- Core deposit growth reducing funding costs
- Potential for further NIM expansion if rate cuts continue
Negative:
- Commercial real estate stress in broader market
- Potential for additional charge-offs if multi-family valuations deteriorate
- Earnings base remains below pre-2024 levels
Key Takeaways
-
Credit inflection confirmed: Criticized loans down 27% YoY, NPLs down 34% QoQ — management says problem loans are "largely identified"
-
Sequential momentum building: EPS +32% QoQ, net income +24% QoQ, NIM +7 bps
-
Record operational performance: Highest-ever tangible book value ($37.51), total assets ($19.4B), and multi-family gain on sale
-
YoY comparisons still challenged: FY2025 EPS of $3.78 down 40% from FY2024's $6.30
-
Management confident in 2026: "Decisive shift" language and emphasis on "positioning for growth"
Data sourced from Merchants Bancorp 8-K filed January 28, 2026. Market data from S&P Global.